

Modal & Vibration Analysis: From a Single Mass to a Structure
Every vibrating structure, no matter how complex, is built out of the same three ingredients: mass, stiffness, and damping. A single mass on a spring and a three-tier equipment rack are governed by the same physics — the rack just distributes those same ingredients across several connected points instead of concentrating them in one mass.
O'Donnell Consulting Engineers, Inc. | Technical Resources
The Single Mass-Spring-Damper System
Take a block of mass m sitting on a spring of stiffness k, with a damper of coefficient c in parallel. It has exactly one coordinate describing its motion — displacement from equilibrium — so engineers call it a single degree-of-freedom (SDOF) system. Three physical effects govern how it moves: inertia (how hard the mass is to accelerate), damping (how the system bleeds off energy), and stiffness (how strongly it's pulled back toward equilibrium). Nearly every vibration problem — a phone buzzing on a desk, a ceiling fan wobbling on its mount, a pump on a rack — is some version of this same balance; the rest of vibration analysis is learning how that balance plays out for more complicated shapes.
Natural Frequency and Damping
Displace the mass by hand and let go, and it settles into its natural frequency — the rate it wants to oscillate at, set by how stiff it is relative to how heavy it is. Stiffer or lighter means a higher natural frequency; softer or heavier means a lower one. How quickly the oscillation dies out is governed by damping, expressed as a dimensionless damping ratio. Lightly damped systems, typical of metal structures, ring for many cycles before settling; heavily damped systems barely oscillate at all before returning to rest.
From One Mass to Many
A real structure rarely has just one lump of mass and one spring — a rack, a floor, a bridge deck each has mass distributed across multiple points, connected by members with their own stiffness. Once more than one coordinate is needed to describe the motion, the same mass-stiffness-damping balance from the single-mass system has to be tracked for every mass at once, and the coupling between them matters just as much as each mass on its own.
Solving that coupled system is the heart of modal analysis. For a structure with several masses, it produces several natural frequencies, each paired with a mode shape — a pattern describing the relative amplitude and direction each mass moves in when the structure vibrates at that one frequency. A structure vibrating freely is really just its mode shapes layered together, each oscillating at its own frequency and decaying at its own rate.
Worked Example: An Equipment Rack With Three Masses
Consider a rack structure with three tiers, each holding a piece of equipment: a pump at the base, a control unit in the middle, and a light instrument package at the top. Each tier is connected to the one below by a rack member acting as a spring. Lumping each piece of equipment as a mass gives a three-degree-of-freedom model — three copies of the SDOF system, coupled together.
Each mass is coupled to its neighbors through the rack member connecting them — physically, the spring between two masses pulls on both of them, so none of the three moves entirely independently. Solving this coupled system gives three natural frequencies and three mode shapes. Using representative values — instrument 40 kg, control unit 120 kg, pump 260 kg, and rack members of comparable stiffness — gives:
| Mode | Frequency | Shape Description |
|---|---|---|
| 1 | 6.9 Hz | All three masses move together, in phase — the rack sways as a unit. |
| 2 | 19.4 Hz | Instrument and control moving together, opposite pump. |
| 3 | 31.2 Hz | Instrument moves opposite the other two, with the largest relative amplitude. |
The pattern worth noticing: the lightest, most flexibly-mounted equipment dominates the highest-frequency mode, while the heaviest and stiffest-mounted dominates the lowest. This is generally true of lumped-mass structures and is why equipment selection and mounting stiffness both matter to a rack's dynamic behavior, not just its static load rating.
Where FEA Fits In
The three-mass rack above is simple enough to solve by hand, but most real equipment racks, skids, and support frames aren't. Their mass is distributed continuously through plates, beams, and gussets rather than lumped into three neat blocks, and their stiffness depends on the full three-dimensional geometry of the structure. For that level of complexity, finite element analysis (FEA) is the standard tool.
A modal FEA run builds the same mass-stiffness picture as the hand calculation above, just automatically and at much finer resolution — the software divides the structure into thousands of small elements, assembles their combined mass and stiffness, and solves for the natural frequencies and mode shapes directly. The output is the same kind of information as the rack example: a list of natural frequencies, each with an animated mode shape showing how the structure actually deforms at that frequency. That makes it straightforward to check whether an operating frequency lines up with a mode, and to see exactly which part of the structure is driving the problem — information a hand calculation on a simplified model can only approximate.
Assessment Methods
Several approaches are available, each offering progressively finer resolution at greater cost:
Hand Calculation
Lumped-mass models solved by hand or spreadsheet for simple rack and frame geometries. Fast, transparent, and sufficient for early screening.
SDOF / small MDOFFinite Element Modal Analysis
Full structural FEA extracts natural frequencies and mode shapes for complex or continuous geometry that hand methods can't capture.
FEAExperimental Modal Testing
Impact hammer or shaker testing measures the as-built structure's actual frequencies and mode shapes, validating or correcting the FEA model.
EMTVibration Severity Monitoring
In-service velocity or acceleration measurements compared against established severity charts to flag developing problems.
ISO 10816 / 20816Design Guidance to Avoid Resonance
- Separate operating frequency from natural frequency. A common rule of thumb keeps them at least 20–25% apart; closer margins need damping or isolation to control amplification.
- Add stiffening rather than mass where possible. Raising k moves natural frequencies up; adding mass moves them down — know which direction the structure needs.
- Isolate, don't fight, unavoidable resonances. Vibration isolators shift the effective natural frequency of a mounted component well below the disturbing frequency.
- Account for equipment mass distribution. The heaviest, most rigidly mounted equipment should generally sit lowest on a rack or frame, consistent with how the lowest mode behaves.
- Verify with as-built testing. Analytical models are only as good as their assumptions about boundary conditions and connection stiffness — experimental modal testing closes that gap.
How Vibration Leads to Fatigue
A structure vibrating at or near a natural frequency isn't just moving — every cycle of that motion also cycles the stress in the material, pulling and releasing it thousands or millions of times over. A single cycle at a modest stress level does essentially nothing. Repeated over enough cycles, though, that same stress can open a crack that a static load of the same magnitude would never cause. This is fatigue, and it's why vibration is a structural concern even when the peak stress is well below what the material could support in a single static pull.
Fatigue damage tends to start at the same places stress naturally concentrates — a weld toe, a sharp corner, a bolt hole, a change in section. Each stress cycle at that location grows a microscopic crack by a tiny amount. Early on, nothing is visible and the structure looks and performs normally. As the crack lengthens, it grows faster with each cycle, because it's concentrating the same stress over less remaining material. Left unaddressed, this ends the same way every time: the crack reaches a size the remaining material can no longer carry, and the part fractures — often suddenly, and often at a stress far below what an inspector would flag as dangerous if they were only looking at static load capacity.
Testing Materials: The Mean Failure Curve
Fatigue behavior is determined experimentally. A batch of identical test specimens is cycled at a fixed stress amplitude until each one fractures, and the number of cycles to failure is recorded. The test is repeated at several different stress levels — high stress amplitudes fail quickly, in thousands of cycles; low stress amplitudes can take millions. Plotting stress amplitude against cycles to failure produces the material's S-N curve: higher stress means shorter life, and below some threshold the material can often sustain stress indefinitely without failing.
Because no two test specimens are identical, the same stress level doesn't produce the same life every time — there's scatter in the results. The mean curve traces the average behavior across that scatter: half the test population would be expected to outlast it, half would fail sooner.
From Mean Curve to Design Curve
A mean curve isn't safe to design to directly — by definition, half of all real parts would be expected to fail before reaching it. Design codes instead shift the curve down by a margin that accounts for the scatter in the test data, uncertainty in real-world loading, and the difference between a polished lab specimen and an actual welded or machined structure. The result is a design curve set well below the mean: a bounding line intended to sit beneath the vast majority of possible outcomes, not the average one.
References
- Rao, S. S. Mechanical Vibrations, 6th ed. Pearson, 2017.
- Inman, D. J. Engineering Vibration, 4th ed. Pearson, 2014.
- Thomson, W. T. & Dahleh, M. D. Theory of Vibration with Applications, 5th ed. Prentice Hall, 1998.
- Chopra, A. K. Dynamics of Structures: Theory and Applications to Earthquake Engineering, 5th ed. Pearson, 2016.
- Ewins, D. J. Modal Testing: Theory, Practice and Application, 2nd ed. Research Studies Press, 2000.
- Craig, R. R. & Kurdila, A. J. Fundamentals of Structural Dynamics, 2nd ed. Wiley, 2006.
- International Organization for Standardization. ISO 10816 / ISO 20816 — Mechanical Vibration — Evaluation of Machine Vibration by Measurements on Non-Rotating Parts. ISO, current edition.
- Budynas, R. G. & Nisbett, J. K. Shigley's Mechanical Engineering Design, 11th ed. McGraw-Hill, 2020.
- ASME Boiler and Pressure Vessel Code, Section VIII, Division 2, Part 5 — Fatigue Assessment. ASME, current edition.
- Stephens, R. I., Fatemi, A., Stephens, R. R., & Fuchs, H. O. Metal Fatigue in Engineering, 2nd ed. Wiley, 2000.
- MMPDS Coordination Committee. Metallic Materials Properties Development and Standardization (MMPDS), current edition. The standard source of statistically-derived material design allowables, including fatigue design curves, widely used in aerospace and defense structural design.
Related Projects
Vibration Analysis on ASTM A514 Grade B Steel Industrial Impeller
| Vibration analysis on an ASTM A514 Grade B Steel industrial impeller to determine its natural frequencies. View project details → | 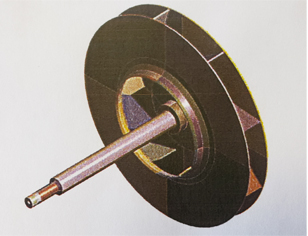 |
Modal & Vibration Analysis of Extruder
| Modal and vibration analysis of an extruder assembly – and develop subsequent design recommendations. View project details → |  |
See Also
- Service: Vibration & Fatigue Analysis – Modal and vibration/ shock/ seismic/ fatigue analysis to evaluate the service life of components
- Service: API 579-1 / ASME FFS-1 Fitness for Service Evaluations – Overview of our Fitness-For-Service capabilities and methods
- Article: Introduction to Failure Analysis – Understanding degradation mechanisms and failure modes that drive FFS assessment needs
- Quantifying Fitness For Service: Article by Bill O’Donnell, Sr. (PDF) – Technical perspective on FFS methodology from a pioneer in ASME fatigue code development
